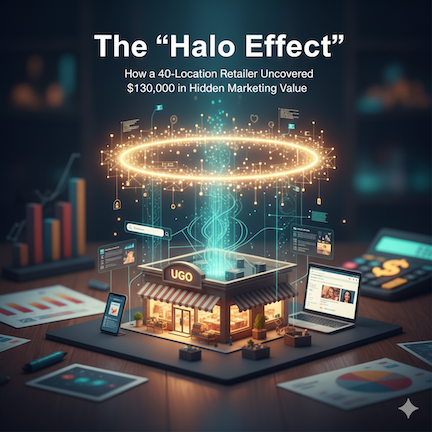
How a 40-Location Retailer Uncovered $130,000 in Hidden Marketing Value
In the world of high-volume retail, the “Holy Grail” of marketing has always been attribution. For decades, shop owners and marketing directors have stared at digital dashboards, wondering whether the person who clicked a Facebook ad on a Monday is the same person who bought a gallon of milk on a Saturday.
Traditionally, we’ve been forced to settle for “siloed” reporting—data that lives in separate boxes. Google Ads tells you about clicks; Meta tells you about impressions; Google Analytics tells you about website visitors; and Placer.ai tells you about foot traffic.
But for a 40-location grocery retailer, we decided to break the silos. We performed a deep-dive correlation analysis covering a full year of data (Feb 2025 – Feb 2026) to answer one question: What is our marketing actually getting us?
The result was the discovery of the “Halo Effect”—a predictable, 16-day cycle that proves digital ads aren’t just an expense; they are a physical traffic driver that creates hundreds of thousands of dollars in “invisible” brand equity.
1. The Search for the “Smoking Gun” (Methodology)
To move beyond guesswork, we utilized four distinct data streams to map the customer journey:
- Paid Media: Every dollar spent on Google and Meta Ads.
- Search Demand: Every “Branded” search (people typing the store’s name into Google).
- Digital Traffic: Behavior tracking via GA4.
- Physical Reality: Daily foot traffic across all 40 stores via Placer.ai.
We applied a statistical tool called the Pearson Correlation Coefficient ($r$). In retail, data is “noisy”—impacted by weather, holidays, and paydays. A correlation of $0.0$ means no relationship. A correlation of $1.0$ is a perfect twin.
For this retailer, we found a correlation of 0.70. This is a “Strong” signal, mathematically proving that 70% of the movement in their organic search traffic is directly explained by changes in their ad budget.
2. The 16-Day “Memory Window”
The biggest mistake marketers make is expecting immediate results. If you spend $1,000 on Monday and don’t see a spike on Tuesday, the temptation is to call the campaign a failure. Our analysis proved that the human brain doesn’t work that way.
By using Time-Lag Analysis, we identified a three-stage “Memory Window” that governs how customers shop:
- The Spark (Day 0): The customer sees an ad on their Facebook feed or while browsing a website.
- The Intent (Day 6–13): The ad acts as a “mental bookmark.” The customer doesn’t click immediately, but they remember the brand. Peak “Branded Search” (typing the store’s name) occurs 6 days after a Google ad and 13 days after a Meta ad.
- The Action (Day 16): Physical store visits peak 3 days after that initial search.
The Conclusion: It takes a total of 16 days for a dollar spent on social media to fully “ripen” into a pair of shoes walking through your front door.
3. The “BOGO” Traffic Effect
Once we identified the link between ads and organic search, we uncovered a massive “bonus” value that was previously invisible. We found that for every 1,000 visitors the retailer paid for, the ads “earned” an additional 313 visitors for free through brand recall.
We call this “Earned Search Equity.” Because the ads were so effective at building top-of-mind awareness, people later in the week began searching for the store by name.
To quantify this, we asked: What would it cost to buy those “free” visitors in the Google auction?
- The Lift: 251,393 “Earned” Organic Sessions.
- The Market Rate: An average Search CPC of $0.52.
- The Hidden Asset: $130,724.
By running paid Google Display and Meta Ads, the retailer didn’t just get clicks; they generated over $130k in “free” traffic that they otherwise would have had to pay for.
4. Re-Defining the ROI: The Blended Cost per Visit
Traditional reporting is pessimistic. If you spend $500 to get 1,000 clicks, the report says your Cost-per-Visit is $0.50.
But our “Halo Effect” analysis enables us to examine the Blended Real Cost. When you factor in the 31% bonus traffic generated by the ads, the retailer’s efficiency skyrocketed:
- Reported Cost: $0.55 per visit.
- Real Cost: $0.44 per visit.
By acknowledging the Halo Effect, we proved that the marketing budget was 20% more efficient than management previously believed. This transformed the conversation from “Where can we cut the budget?” to “How can we scale this engine?”
5. Strategic Takeaways for Multi-Unit Retailers
So, what does this mean for a data-driven marketer?
A. Consistency is the Ultimate Weapon
Because there is a 16-day lag between an ad view and a store visit, consistency is vital. When a retailer cuts their budget for “one week” to save money, they are unknowingly creating a “traffic hole” that will hit their stores 14 days later. You cannot “turn on” foot traffic like a faucet; you must keep the pump primed.
B. Different Channels, Different Speeds
We found that Meta Ads (Facebook/Instagram) are the strongest long-term brand builders, but they require the most patience (13-day search lag). Google Display and Search act as the “short-term” stimulants (with a 6-day search lag). A healthy retail strategy requires both: Meta to build the future, and Google to capture the present.
C. Measure “Brand Intent” as a Leading Indicator
If you want to know whether your stores will be busy next weekend, check your Branded Search Volume (Google Search Console) today. We found a 0.53 correlation between branded searches and store visits 3 days later. It is the single most accurate “early warning system” for retail revenue.
The Verdict
The era of guessing is over. By correlating digital spend with physical foot traffic, we’ve proven that marketing drives the bottom line.
For this 40-location retailer, the data was clear: Marketing isn’t just about the click you see today; it’s about the “Halo” that follows the customer for the next 16 days. By measuring the Blended Cost per Store Visit, we moved beyond technical metrics and started speaking the only language that matters in retail: growth.
Is your marketing team missing 30% of your data?
The “Halo Effect” is likely happening in your business right now. If you aren’t correlating your spend to your branded search and foot traffic, you are likely under-reporting your ROI by 20% or more. Stop looking at silos—start looking at the Halo.
Schedule a meeting below, and we’ll provide an analysis of how this concept aligns with your marketing budget.